This is a website for an H2020 project which concluded in 2019 and established the core elements of EOSC. The project's results now live further in www.eosc-portal.eu and www.egi.eu
This is a website for an H2020 project which concluded in 2019 and established the core elements of EOSC. The project's results now live further in www.eosc-portal.eu and www.egi.eu
 Alex Vermeulen on how ICOS is contributing to the science of climate change
ICOS is tied to one of the largest challenges of our time - climate change.
Climate change is caused by greenhouse gas emissions related to human activities, such as traffic and industrial production. ICOS observes the gases, their sources, transport, sinks, and finally their balance, and produces high-quality, standardised data on them. The ICOS observations are shared freely to be used, for example, in scientific and policy relevant assessments. Even these results can be published and communicated through ICOS.
In the Paris Agreement, most of the world committed to reduce the human caused greenhouse gas emissions to zero by 2050. However, there are still many uncertainties in emission levels. The changing climate itself also strongly influences the natural uptake and emissions of greenhouse gases. This needs to be taken into account when politicians set the emission reduction goals and paths.
ICOS involves more than 70 institutes from all over Europe and about 500 scientists and technicians in the field, laboratories and other facilities. We have more than 130 stations distributed throughout the twelve Member and Observer countries, and are working hard to add new states to the network, in order to further improve the spatial coverage. ICOS has been established as an ERIC, European Research Infrastructure System, since November 2015. The Thematic Centres, laboratories, Carbon Portal and Head Office are all located in different member countries, and operated jointly by several members.
ICOS provides quality-controlled high-precision time series of greenhouse gas atmospheric concentrations and exchange fluxes in all three domains: Atmosphere, Ecosystem and Ocean. ICOS also delivers near real-time information with a delay of maximum 24 hours of the same variables. And finally we store and make available all ICOS data, both raw data and relevant metadata, through the faceted data portal. We strive for maximum transparency and granularity, so each data object has a persistent identifier. All metadata and data are linked through a linked open data approach, and users can also query our (meta)data. We also provide users with the opportunity to collaboratively get access to ICOS and ancillary data in so called virtual research environments, for example making use of Jupyter notebooks. Through this they get direct access to the data without the need to download and locally store the data, and they can create a transparent and reproducible workflow. The end result of this work can then be published and shared through the ICOS Carbon Portal. We plan to select useful products and models to develop through this platform and turn them through co-design with the atmospheric communities into operational services that are served from the ICOS Carbon portal. Furthermore, we will offer services that are directly usable by policy makers and the general public to evaluate the progress of emission reductions in their region. This will be done by using data assimilation techniques that use the ICOS observations and combine this with elaborate models to improve the emission estimates and decrease their uncertainties.
The basic observational data that ICOS provides, including the raw data, is not very large, however it won’t fit the average single server. The ancillary data needed to run the models that are required to interpret the data are, however, several orders of magnitude larger. For example, data assimilation models require millions of CPU compute hours, large memory resources and data storage for every calculation. And the relatively simple Footprint Tool that we run, needs several terabytes of spinning disk storage.
We already make use of EOSC-hub compute and storage services and we are working together with the project, as a Competence Centre, to optimize our workflows. For example: In the Footprint Tool case, data is stored on B2SAFE and taken to/from the ICOS Carbon Portal. Users interact only with the ICOS Carbon Portal, which instantiates virtual machines (VMs) in the EGI Federated Cloud. For the Ecosystem GHG Flux case, ICOS will build on a current pilot under development in the framework of ENVRIplus. This is currently using the gCube Data Analytics platform, combining resources from D4Science and EGI to orchestrate parallelised High-Throughput Compute processes.
To improve the quality of the data assimilation and to make full use of all the information in the ICOS observations, the evaluation models need a better resolution. An increase in resolution with a factor of 10 – which is needed to reach the kilometer scale – would increase the demand by factor 1000. So, more challenges ahead!
Alex Vermeulen is the Director of the open data portal of ICOS, i.e. Integrated Carbon Observation System.
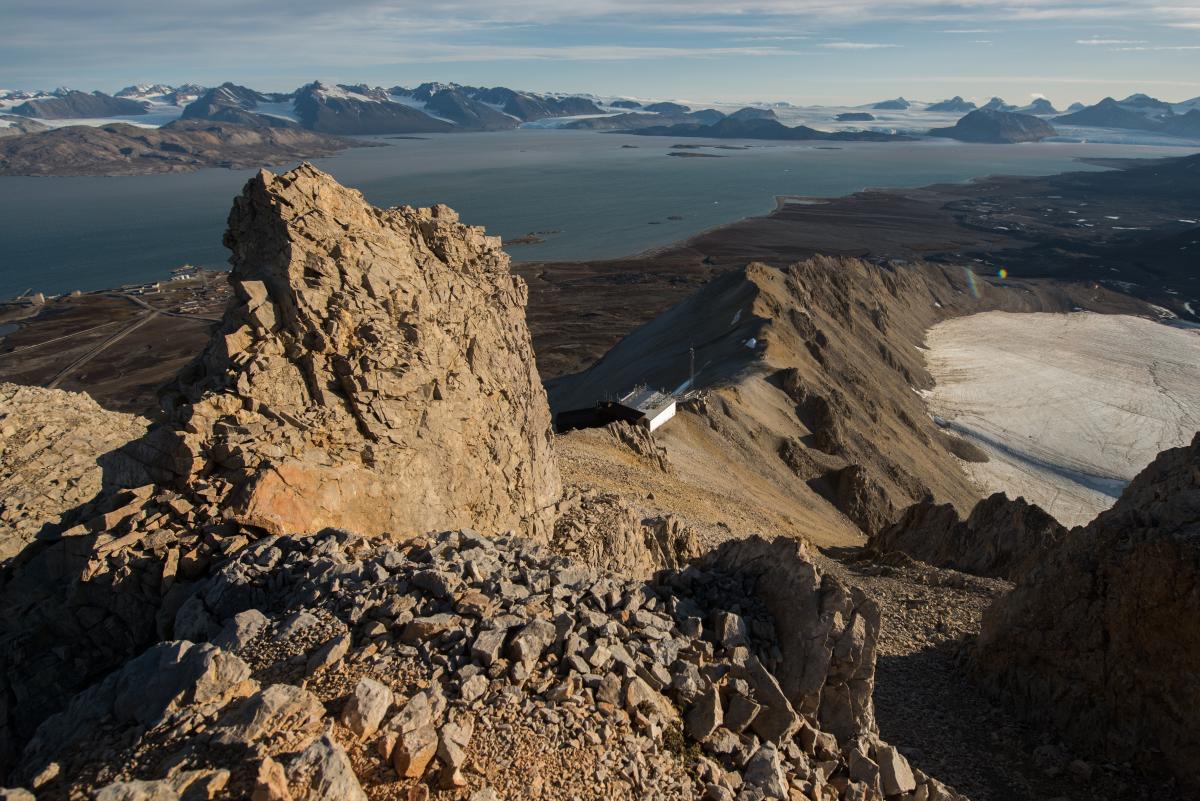
Photo copyright: image by Konsta Punkka, ICOS Zeppelin Atmosphere Statio located in the Arctic Ocean, Svalbard archipelago, Norway.
More information: ICOS research community
EOSC-hub receives funding from the European Union’s Horizon 2020 research and innovation programme under grant agreement No. 777536.